
Google PageSpeed Insights: How to Check and Improve Your Website Speed
Is your website losing 53% of visitors due to slow loading? Does every second of delay reduce conversions by 7%? Spoiler: Google PageSpeed Insights will reveal all issues in 30 seconds and provide ready-made solutions.
⚡ TL;DR
- ✅ PageSpeed Insights: Google's free tool for website speed check
- ✅ Core Web Vitals: Three key metrics (LCP, FID/INP, CLS) that have impacted SEO since 2021
- ✅ Practical Value: Specific code recommendations for score improvement
- ✅ 90+ Score: An achievable result with 2-3 hours of optimization
- 🎯 You Will Get: A step-by-step guide to achieving maximum website speed
- 👇 Read More Below — with code examples and real-world case studies
Table of Contents:
- 📌 What is Google PageSpeed Insights
- 📌 How to Use the Tool
- 📌 Core Web Vitals: Key Metrics
- 💼 Top 10 Speed Problems and Solutions
- 🛠️ Step-by-Step Website Optimization
- 📊 Monitoring Tools
- 📈 Website Speed and SEO
- ⚖️ WordPress vs Shopify vs Custom
- 💡 Real-World Optimization Case Studies
- ❓ Frequently Asked Questions (FAQ)
- ✅ Conclusions
⸻
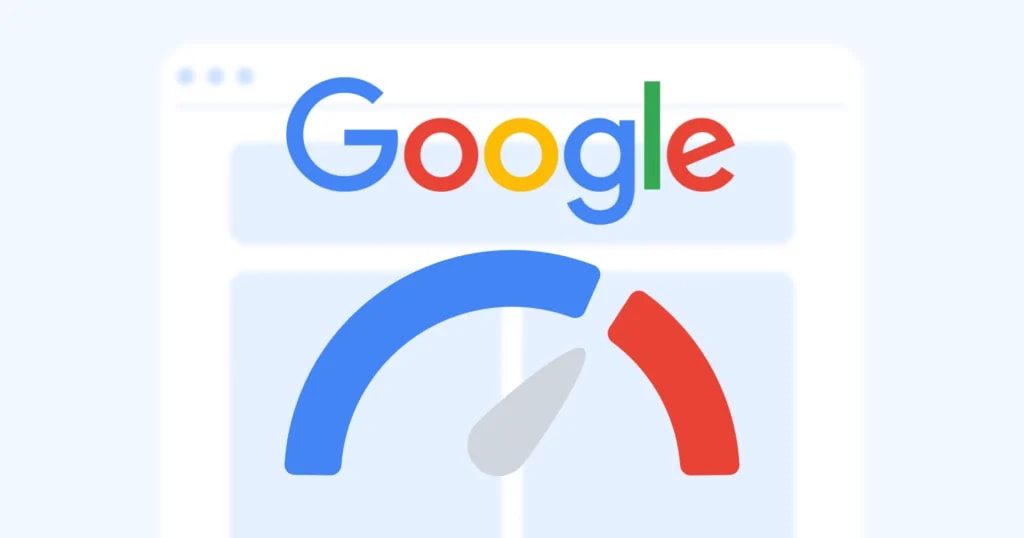
🎯 What is Google PageSpeed Insights
Google PageSpeed Insights is a free tool from Google for analyzing the loading speed of web pages on mobile devices and desktops.
The tool is available at https://pagespeed.web.dev/ and displays a score from 0 to 100, where higher is better.
📊 Why Website Speed is Critical
Google statistics show striking figures:
- 📉 53% of users leave a site if it takes more than 3 seconds to load
- 📉 1 second delay = -7% conversions (millions of dollars for e-commerce)
- 📉 Every 100ms delay = -1% sales (Amazon study)
- 📈 Fast sites get 25% more organic traffic
👉 Real-world example: Walmart's online store improved its loading speed by 1 second and gained +2% conversions. That's millions of dollars in additional annual revenue.
What PageSpeed Insights Shows:
- ✅ Performance Score: Overall score from 0 to 100
- ✅ Field Data: Real user data (Chrome User Experience Report)
- ✅ Lab Data: Simulated testing under controlled conditions
- ✅ Core Web Vitals: Google's three key metrics
- ✅ Opportunities: Specific recommendations for improvement
- ✅ Diagnostics: Additional information about issues
Website speed affects Google ranking through the Page Experience signal, introduced in 2021.
✅ Quick Summary: PageSpeed Insights is not just a speed tester, but a comprehensive tool for diagnosing and optimizing website performance.
⸻
🔬 How to Use Google PageSpeed Insights
The checking process takes 30-60 seconds and requires no technical skills.
📈 Step-by-Step Guide
Step 1: Open the Tool
Go to the official PageSpeed Insights page.
Step 2: Enter the URL
Paste the full address of the page you want to test (e.g., https://example.com).
Step 3: Wait for Results
The analysis takes 20-40 seconds. Google tests the page twice: for mobile and desktop versions.
Step 4: Analyze the Report
Decoding the Performance Score:
- 🟢 90-100 points: Excellent
- 🟡 50-89 points: Needs Improvement
🔴 0-49 points: Poor
Field Data vs Lab Data: What's the Difference?
| Data Type | What It Is | Advantages |
|---|---|---|
| Field Data | Real data from Chrome users over the last 28 days | Shows actual user experience |
| Lab Data | Testing in a controlled environment (Lighthouse) | Helps find specific issues |
⚡ Important: Field Data is only available for sites with sufficient traffic. New sites will only have Lab Data.
How to Read the Opportunities Section:
Each recommendation shows:
- 🔹 Problem Name: e.g., "Properly size images"
- 🔹 Potential Time Savings: how many seconds can be gained
- 🔹 Resource List: which files need optimization
- 🔹 Link to Documentation: how to fix the issue
Set up tracking through Google Analytics to monitor the impact of optimization on behavioral metrics.
✅ Quick Summary: Focus on the mobile version, as Google has been using mobile-first indexing since 2019.
⸻
⚠️ Core Web Vitals: Key Metrics
Core Web Vitals are three main indicators that Google uses to assess the quality of user experience.
📊 LCP (Largest Contentful Paint)
What it is: The time it takes for the largest visible element on the page (image, video, text block) to load.
- 🟢 Good: Less than 2.5 seconds
- 🟡 Needs Improvement: 2.5–4 seconds
- 🔴 Poor: More than 4 seconds
How to improve LCP:
- ✅ Optimize images (WebP format, compression)
- ✅ Use a CDN for faster content delivery
- ✅ Eliminate render-blocking CSS and JavaScript
- ✅ Improve server speed (upgrade hosting)
📊 FID (First Input Delay) / INP (Interaction to Next Paint)
What it is: The time from the user's first interaction (click, tap) to the browser's response.
- 🟢 Good FID: Less than 100 milliseconds
- 🟢 Good INP: Less than 200 milliseconds
- 🟡 Needs Improvement: 100–300 ms (FID) / 200–500 ms (INP)
- 🔴 Poor: More than 300 ms (FID) / 500 ms (INP)
⚡ Important: Starting March 2024, Google is replacing FID with INP (Interaction to Next Paint) as the main interactivity metric.
How to improve FID/INP:
- ✅ Minimize JavaScript (remove unused code)
- ✅ Use Web Workers for heavy computations
- ✅ Break down long tasks into smaller chunks
- ✅ Delay the loading of third-party scripts
📊 CLS (Cumulative Layout Shift)
What it is: A measure of visual stability — how much the page "jumps" during loading.
- 🟢 Good: Less than 0.1
- 🟡 Needs Improvement: 0.1–0.25
- 🔴 Poor: More than 0.25
👉 Typical CLS problem: A user wants to click the "Buy" button, but at the last moment, an advertising banner loads, the button shifts down, and the user accidentally clicks on the ad. This is bad for UX.
How to improve CLS:
- ✅ Set width/height attributes for all images and videos
- ✅ Reserve space for dynamic content (ads, widgets)
- ✅ Avoid inserting content above existing content
- ✅ Use font-display: swap for web fonts
📊 Core Web Vitals Standards Table
| Metric | Good | Needs Improvement | Poor |
|---|---|---|---|
| LCP | ≤ 2.5 sec | 2.5–4 sec | > 4 sec |
| INP | ≤ 200 ms | 200–500 ms | > 500 ms |
| CLS | ≤ 0.1 | 0.1–0.25 | > 0.25 |
Monitor metrics through Google Search Console in the "Core Web Vitals" section.
✅ Quick Summary: Achieving "green" scores across all three metrics significantly improves user experience and SEO.
⸻
💡 Top 10 Speed Problems and Their Solutions
Based on the analysis of millions of sites, here are the most common problems and ready-made solutions.
❌ Problem 1: Large Unoptimized Images
Symptom: PageSpeed shows "Properly size images" or "Serve images in next-gen formats"
Solution:
- ✅ Convert JPEG/PNG to WebP format (saves 25–35% of size)
- ✅ Use tools: TinyPNG, ImageOptim, Squoosh
- ✅ Add lazy loading:
<img src="image.webp" alt="Description" loading="lazy" width="800" height="600">❌ Problem 2: Browser Caching is Not Used
Symptom: "Leverage browser caching"
Solution for Apache (.htaccess):
<IfModule mod_expires.c>ExpiresActive On
ExpiresByType image/webp "access plus 1 year"
ExpiresByType text/css "access plus 1 month"
ExpiresByType application/javascript "access plus 1 month"
</IfModule>
❌ Problem 3: Render-Blocking CSS and JavaScript
Symptom: "Eliminate render-blocking resources"
Solution:
- ✅ Add the
deferattribute for JavaScript:
<script src="script.js" defer></script>- ✅ Inline critical CSS directly in the
<head> - ✅ Load the rest of the CSS asynchronously:
<link rel="preload" href="styles.css" as="style" onload="this.onload=null;this.rel='stylesheet'">❌ Problem 4: Slow Server (High TTFB)
Symptom: "Reduce server response time (TTFB)"
Solution:
- ✅ Update to PHP 8.2+ (30–50% faster than PHP 7.4)
- ✅ Connect a CDN (Cloudflare, BunnyCDN)
- ✅ Optimize the database (for WordPress: WP-Optimize)
- ✅ Change hosting to VPS or cloud (AWS, DigitalOcean)
❌ Problem 5: Uncompressed Content
Symptom: "Enable text compression"
Solution for Nginx:
gzip on;gzip_types text/plain text/css application/json application/javascript;
gzip_min_length 1000;
Or use the more modern **Brotli** (compresses 15–20% better than Gzip).
❌ Problem 6: Too Many HTTP Requests
Symptom: Dozens of separate CSS/JS files
Solution:
- ✅ Combine CSS files into one
- ✅ Combine JavaScript files
- ✅ Use CSS sprites for icons
- ✅ For WordPress: Autoptimize plugin
❌ Problem 7: Missing Preload for Critical Resources
Symptom: Fonts load late
Solution:
<link rel="preload" href="/fonts/font.woff2" as="font" type="font/woff2" crossorigin>❌ Problem 8: Third-Party Scripts Slow Down the Site
Symptom: Google Analytics, Facebook Pixel, chat widgets block loading
Solution:
- ✅ Load through Google Tag Manager with a delay
- ✅ Use the
asyncattribute:
<script async src="https://www.googletagmanager.com/gtag/js"></script>❌ Problem 9: Large Web Fonts
Symptom: "Ensure text remains visible during webfont load"
Solution:
@font-face {font-family: 'MyFont';
src: url('font.woff2') format('woff2');
font-display: swap; /* Shows a system font while the custom one loads */
}
❌ Problem 10: Lack of HTTP/2
Symptom: Server uses the older HTTP/1.1
Solution:
- ✅ Update the server to HTTP/2 (nginx 1.9.5+, Apache 2.4.17+)
- ✅ Or use Cloudflare (automatically adds HTTP/2)
💡 Expert Tip: Start optimization with the issues that offer the greatest time savings (PageSpeed shows this in seconds).
✅ Quick Summary: 80% of speed issues are resolved by optimizing images and configuring caching.
⸻
🛠️ Step-by-Step Website Speed Optimization
Here is a practical action plan for achieving a 90+ score in PageSpeed Insights.
📋 Stage 1: Current State Audit
- Test the site via PageSpeed Insights
- Record baseline metrics (Performance Score, LCP, INP, CLS)
- Take a screenshot of the report for comparison after optimization
- Export the list of Opportunities into a spreadsheet
📋 Stage 2: Image Optimization (Most Important)
- Convert all JPEG/PNG to WebP via Squoosh
- Compress images (80–85% quality is optimal)
- Add the
loading="lazy"attribute for all images except those on the first screen - Set width/height for every image (to avoid CLS)
📋 Stage 3: Caching Configuration
For WordPress:
- Install a plugin like WP Rocket or W3 Total Cache
- Enable browser caching and page caching
- Configure GZIP compression
For Nginx (manual):
location ~* \.(jpg|jpeg|png|gif|webp|css|js)$ {expires 365d;
add_header Cache-Control "public, immutable";
}
📋 Stage 4: CSS/JS Minimization
- ✅ Remove unused CSS via Chrome DevTools Coverage
- ✅ Minify files using online minimizers or build tools
- ✅ Combine multiple files into one (where possible)
📋 Stage 5: CDN Connection
Cloudflare (free plan):
- Sign up at cloudflare.com
- Add your domain
- Change the nameservers at your domain registrar
- Enable Auto Minify and Brotli in settings
📋 Stage 6: Server Optimization
- ✅ Update PHP to version 8.2+
- ✅ Enable OPcache for PHP
- ✅ Optimize MySQL (for WordPress: table optimization)
- ✅ Consider migrating to better hosting (if TTFB > 600 ms)
Check for technical errors using the Rich Results Test after major code changes.
✅ Quick Summary: Consistent execution of all stages yields a result of 85–95 points within 2–3 hours of work.
⸻